Getting Started with SAP BI: A Beginner’s Guide
SAP Business Intelligence (SAP BI), a component of the SAP BusinessObjects platform, enables organizations to access, analyze, and visualize data to support better business decision-making. With businesses increasingly relying on data to drive growth, efficiency, and innovation, SAP BI serves as a foundational tool to convert raw data into actionable insights.
This blog post serves as an introduction to SAP BI, outlining its key components, how it benefits different business functions, and how professionals—especially those in finance, operations, and strategy—can get started using the platform effectively.
What is SAP BI?
SAP BI, or Business Intelligence, is part of the larger SAP BusinessObjects (SAP BO) suite. It is designed to enable organizations to make informed decisions by providing tools for:
- Data Integration
- Data Modeling
- Data Analysis
- Report Building
- Dashboard Creation
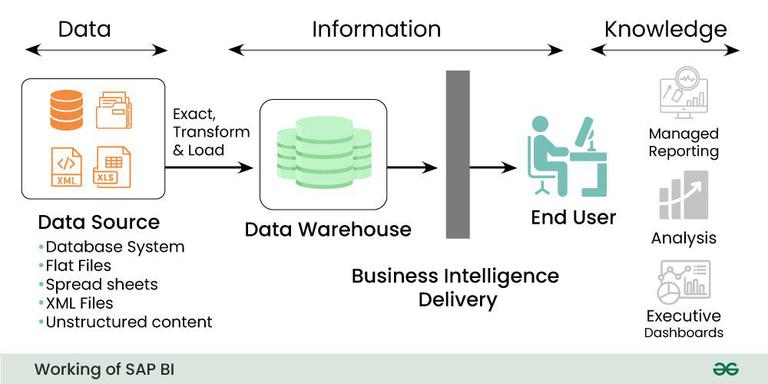
SAP BI consolidates data from various sources (ERP, CRM, databases, spreadsheets, etc.) into a unified reporting environment. Whether your data resides in SAP systems or third-party applications, SAP BI tools allow you to build reports, visualizations, and dashboards to identify trends, track KPIs, and support real-time decision-making.
Core Components of SAP BI
SAP BI offers a range of tools, each catering to different analytical needs and user roles:
1. SAP BusinessObjects Web Intelligence (WebI)
A user-friendly tool for building interactive reports based on business queries. WebI allows users to slice and dice data, drill down into details, and apply filters without deep technical knowledge.
2. SAP Crystal Reports
Ideal for pixel-perfect, print-friendly reporting, Crystal Reports is frequently used in financial reporting and operational summaries.
3. SAP Lumira
SAP Lumira focuses on self-service data discovery and visualization. Business users can combine, visualize, and explore data from multiple sources in an intuitive, drag-and-drop interface.
4. SAP Analysis for Office
A Microsoft Excel-based tool that provides powerful OLAP (Online Analytical Processing) capabilities for users familiar with spreadsheets. This is especially useful for finance teams.
5. Universe Designer (Information Design Tool)
A metadata layer where developers create “universes”—semantic models that map to underlying data sources. This allows business users to query data without knowing technical database structures.
Why Should Professionals Learn SAP BI?
In today’s data-driven world, understanding and leveraging BI tools is no longer a skill reserved for IT teams. Professionals across business functions—including finance, HR, sales, and operations—benefit from the ability to extract meaningful insights from data.
For example:
- Finance: Generate budget vs. actuals reports, cash flow dashboards, and forecast analyses.
- Sales: Track sales performance by region, product line, or rep.
- Operations: Analyze supply chain efficiency and production bottlenecks.
- HR: Monitor workforce trends, attrition rates, and recruitment metrics.
The intuitive interfaces and drag-and-drop functionality in tools like WebI and Lumira empower business users to become self-reliant in reporting, freeing IT from ad-hoc report requests.
Key Features of SAP BI
SAP BI distinguishes itself through several powerful features:
1. Centralized Access to Diverse Data Sources
SAP BI supports integration with SAP HANA, SAP S/4HANA, SAP BW, and non-SAP systems like Oracle, Microsoft SQL Server, and flat files. This centralization allows organizations to unify data across departments.
2. Role-Based Dashboards and Reports
Users can personalize dashboards and reports based on their roles and needs. Executives might see high-level KPIs, while analysts dive deep into operational data.
3. Security and Data Governance
Access to data can be restricted based on user roles, ensuring sensitive information is only accessible to authorized individuals. Audit trails and version control enhance governance.
4. Real-Time Analytics
With integration to in-memory technologies like SAP HANA, SAP BI can deliver near real-time insights, enabling faster decision-making and responsiveness to market changes.
5. Mobile BI
SAP BI also supports mobile platforms, enabling users to access dashboards and reports on smartphones and tablets. This mobility ensures that decision-makers can stay informed wherever they are.
How to Get Started with SAP BI
If you’re new to SAP BI, here’s a step-by-step approach to getting started:
Step 1: Understand Your Reporting Needs
Identify the metrics, KPIs, and business questions you want to answer. Define the audience—executives, managers, analysts—and their data consumption preferences.
Step 2: Get Access to a BI Platform
Most organizations have an existing SAP BI landscape managed by IT. Request access, specifying the type of reports or dashboards you need.
Step 3: Learn Key Tools
Start with Web Intelligence for simple reports. Use Crystal Reports for detailed financial documents, and explore Lumira for self-service visualizations. Excel users will feel at home with Analysis for Office.
Step 4: Take a Training Course
SAP offers several training options:
- SAP Learning Hub
- openSAP online courses
- Third-party tutorials on platforms like Udemy and LinkedIn Learning
Hands-on practice with sample data is essential to mastering SAP BI tools.
Step 5: Collaborate with BI Developers
Work with BI developers to define data requirements and build semantic layers (universes) tailored to your department’s needs. This ensures your self-service tools provide meaningful and accurate insights.
Real-World Use Case: BI for Financial Forecasting
Imagine a mid-sized company that wants to improve its quarterly forecasting process. Using SAP BI:
- Finance teams extract historical revenue and expense data from SAP S/4HANA.
- Data is modeled into a universe that business users can query.
- Reports and dashboards are built in WebI to visualize trends by business unit.
- Executives access real-time KPIs on mobile devices before quarterly board meetings.
- Forecasting accuracy improves, enabling proactive decision-making and cost control.
This example illustrates how SAP BI transforms static spreadsheets into dynamic, collaborative forecasting environments.
Best Practices for SAP BI Success
To maximize value from SAP BI, follow these tips:
- Clean Your Data: Inaccurate or outdated data undermines trust in reports. Ensure your source systems are clean and updated.
- Standardize KPIs: Agree on definitions of key metrics across departments to ensure consistency.
- Automate Reports: Use scheduling and bursting features to send reports to stakeholders on a regular basis.
- Involve Business Users Early: User involvement during the design phase ensures relevance and better adoption.
- Measure ROI: Track how BI tools improve decision speed, accuracy, and business outcomes.
The Future of SAP BI: Moving to SAP Analytics Cloud
While SAP BI tools like WebI and Crystal Reports remain widely used, SAP is gradually transitioning to SAP Analytics Cloud (SAC)—its cloud-native, all-in-one analytics solution. SAC combines BI, planning, and predictive analytics in a single platform.
Advantages of SAP Analytics Cloud include:
- Integrated financial planning capabilities
- Real-time collaboration features
- AI-powered insights and forecasting
- Seamless integration with S/4HANA and other cloud platforms
Professionals who are already familiar with SAP BI will find it easier to adapt to SAC and take advantage of its advanced features.
Conclusion
SAP BI empowers organizations to unlock the full potential of their data. Whether you’re in finance, operations, or strategy, learning how to use SAP BI tools can significantly improve your ability to make data-driven decisions. With a growing emphasis on agility, transparency, and accountability, professionals who harness SAP BI are better positioned to lead their teams and organizations toward success.
Getting started with SAP BI doesn’t require deep technical knowledge—just curiosity, a data-focused mindset, and a willingness to explore the possibilities that business intelligence offers. Start small, build confidence, and soon you’ll be creating insights that matter.